

There is an accepted paradigm in design that if someone wants to do something, they should be able to do it without necessarily understanding all the steps required to do the “thing”. If you want to start your car, you should be able to press a button and the engine comes to life. It is of little interest to the driver that there are dozens of computers executing millions of instructions per second to start an engine at the press of a button. Seems reasonable. Simplify life and the customers will come.
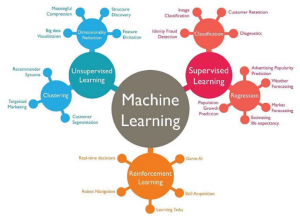
Machine Learning is another paradigm that is being applied by scientist and engineers. The thought is to leverage how the human brain solves problems. Instead of having a set of requirements and building a hardware or software widget to solve a problem, data is collected that represents the problem, and the data are presented to one or more algorithms. The algorithms learn to predict and classify from the patterns extracted from the data.
Machine Learning algorithms have been around for over fifty years.
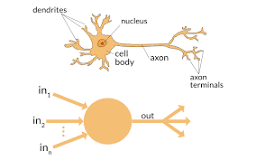
Back, in the beginning of time, the perceptron was introduced. The thought behind the perceptron was to leverage a very successful building block called a neuron – the tiny computer like element that is one of a billion elements that make up the very successful model called the human brain.
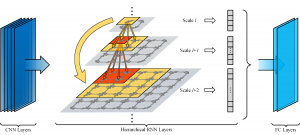
Fast forward fifty or sixty years. Folks have super computers on their desks. A couple of generations of engineers and scientists develop convolutional and recurrent nets that can be used to process streaming data in real time.

So now to the purpose of this post. I have been working with nets for a fair amount of time. As I do everything else, I dove in pushing and probing, looking at the math, learning that art is as important as engineering, learning the importance of clean data and that the data reflect the problem, and which model fit which data. I took courses. I visited a number of web sites. And I read the exchanges on a number of forums.
I started to notice a trend. It became apparent that a fair number of folks do not understand the models that they are applying to solve problems. I thought back to cars — press a button and the engine starts. But before that engine starts, engineers put a lot of time and effort understanding the problem. The engineers built solutions that made starting the car look very easy. My take away from reading the forums is that more and more developers lack understanding of machine learning algorithms.
I am about to finish a course that was developed by Andrew Ng at Stanford ( I am in no way linked to Dr. Ng and Stanford University other than I have learned a great deal from Dr. Ng). You can view the course here. Taking the course helped jog my memory about principles that that I had forgotten. Walking through the equations, taking the quizzes and developing the coding solutions all helped with shoring up my information base. If nothing else, possibilities were pushed to the front of my thought process. I know where to go for references. And Dr. Ng confirmed my conclusions. Many folks do not understand the internal workings of machine learning models. Enormous amounts of time are lost because the time to learn the basics is not applied.
I am going to jump in to the water. For an in-depth discussion of the following, please have a look at Dr. Ng’s course mentioned above.
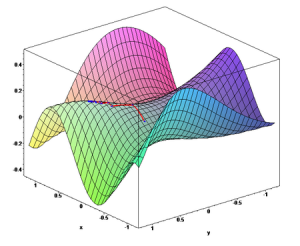
This thought is about learning rates. Many real world problems have solutions that can be represented by undulating concave surfaces. When a machine learning algorithm is looking for an answer, the algorithm steps around the surface, looking for a solution. The solution is said to be found when a minimum is found. It turns out that the size of the step is very important. The size of the step is controlled by setting the learning rate. Finding an acceptable learning rate is very important. If the learning rate is too small, learning can take weeks and months. If the learning rate is too large, a solution can be stepped over or a local minimum can be selected as the answer when in fact the global minimum has completely been missed. Monitoring the cost of a solution is a way to see how well the search is working. Ideally, the cost goes down and levels off at the global minimum. If the cost goes down and then up, it is times to lower the learning rate.
With models such as supervised learning, the idea is the following:
- Just as humans learn, have a set of example data that describe your problem.
- Make sure the examples are not sequential in nature.
- Break the samples into three groups
A. Train 60%
B. Validation 20% You will use your validation data to select a Lambda parameter
C. Test 20%
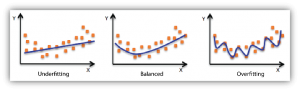
Now we need a hypothesis. A hypothesis is basically an equation that maps to the data in the training set. Above you can see graphs labelled under fitting, balanced, and over fitting.
You can see that with under fitting, the equation does not map well to most points. You can tell if you have under fitting by getting high error rates with both your training and validation data.
You can see that with over fitting you, the equation maps closely to the training data — too closely. With over fitting your net will not be able to generalize — provide answers with new data — with a low error rate.
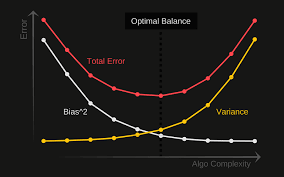
The goal is to get there error rate to a minimum. I think of bias being related to under fitting and variance being related to over fitting.
A misconception is that the more training data you have, the lower the error rate.
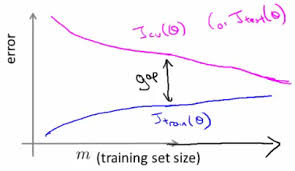
J(theta) is the cost. The top magenta line is the cost when using validation and testing data. The blue line is is the cost when using training data. You can see by adding training data, the error rate levels off and J(Train) and J(Validation) converge. So adding more and more training data does not mean the error rate for validation or testing continues to go down. This slide is from Dr. Ng’s course.
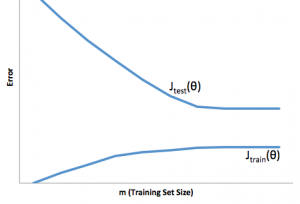
Here we have an example of high variation. Again J(Theta) is the cost. You can see the error rate reaching a level and settling. But the error rate between J(Test) and J(Train) does not converge — a gap is maintained. More training data results in a reduction in the error rate and a consistent error gap between training and testing.
Tips:
- To reduce high variance, use more training data.
- Use smaller set of feature data to reduce high variance.
- Adding feature reduces high bias.
- Adding polynomial features reduces high bias.
- Relatively small neural nets are prone to high bias.
- Relatively large neural nets are prone to over fitting.
- There is a term called regularization. Applying regularization allows for an increase in features, but minimizes the impact on the feature addition. High variation, use regularization.
- There is a term called Lambda. Lambda is a multiplier for regularization. When you are selecting parameters for cross validation, decreasing lambda reduces high bias. Increasing lambda reduces high variation.
- Using polynomials to map to data reduces high bias. Add too many terms, complexity increases, training times increases, and high variance starts appearing — over fitting.
Suggestion:
Take Dr. Ng’s course or something at that level. You will need a basic understanding of linear algebra, but the pay back will be big time.
Any comments:
Troy
troy@biosension.com
6035056500